
Figure 5.
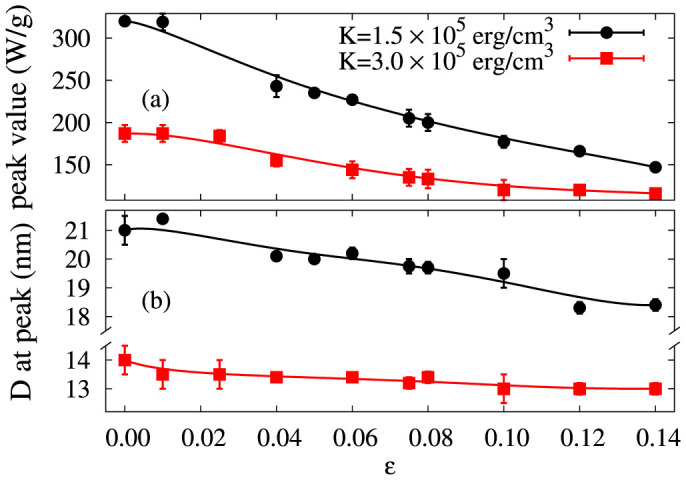
Maximum SAR value (a) and peak position (b) as function packing fraction,  for two values of anisotropy: 3 × 10⁵ erg/cm3 (red squares) and 1.5 × 10⁵ erg/cm3 (black circles). The lines are to guide the eye.
Official websites use .gov
A
.gov website belongs to an official
government organization in the United States.
Secure .gov websites use HTTPS
A lock (
) or https:// means you've safely
connected to the .gov website. Share sensitive
information only on official, secure websites.
Maximum SAR value (a) and peak position (b) as function packing fraction, for two values of anisotropy: 3 × 10⁵ erg/cm3 (red squares) and 1.5 × 10⁵ erg/cm3 (black circles). The lines are to guide the eye.