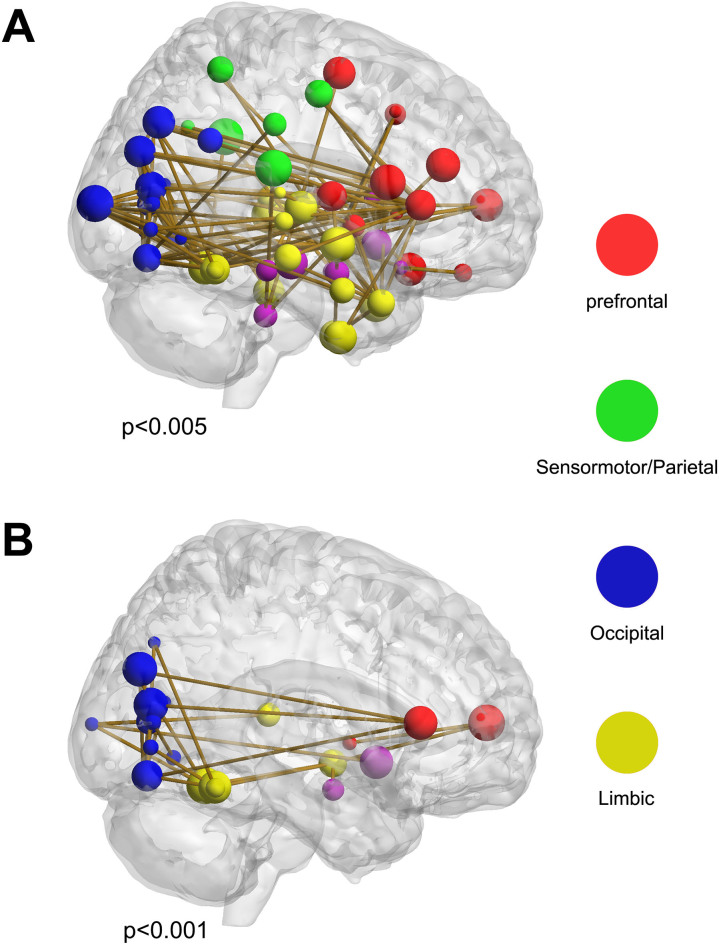
Figure 4. Networks with decreased connections in patients.
(A) The larger network identified by the network based statistical (NBS) analysis method under the liberal primary threshold of p < 0.005; (B) The smaller network identified by NBS under the strict primary threshold of p < 0.001; BraiNet Viewer (http://www.nitrc.org/projects/bnv/) was used for visualization.

