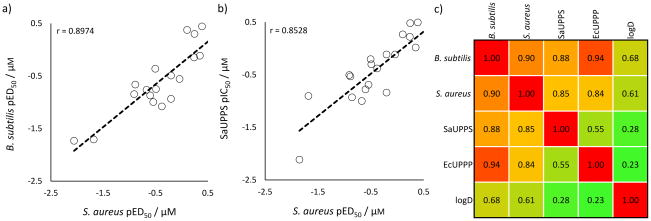
Figure 5.
Correlations between cell growth and enzyme inhibition results. a) Correlation between S. aureus and B. subtilis cell growth inhibition based on pED50 (=−log10ED50 [μM]) results; b) Correlation between S. aureus cell growth inhibition and SaUPPS inhibition; c) Pearson r-value correlation matrix/heat map for S. aureus cell growth inhibition, B. subtilis cell growth inhibition, SaUPPS and EcUPPP enzyme inhibition (all based on pED50 or pIC50 values), and logD. The Pearson r-values are indicated and red/orange=high correlation, green=low correlation.

