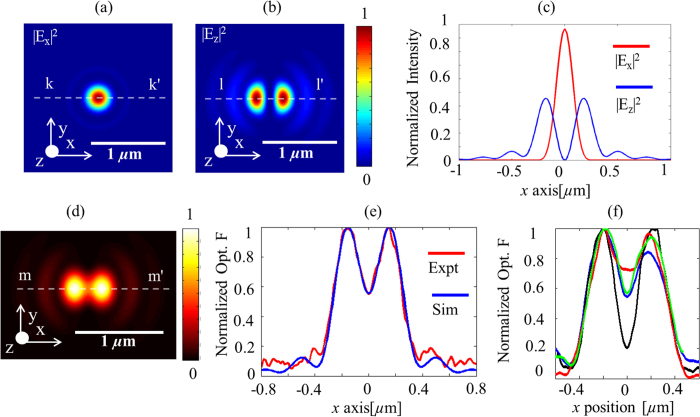
Figure 5.
Spatial intensity distributions on glass at 640 nm of (a)  (b)
(b)  (c) comparison of line traces of
  (along k-k’) and
  (along l-l’) (d) Numerical calculations of normalized optical force obtained by evaluating (1) (e) Comparison of line traces of normalized optical force obtained experimentally (line a-a’ in Fig. 2 (b)) and calculations (line m-m’ in (c)) showing good agreement.(f) Normalized optical force measured experimentally with different gold coated AFM probes.

