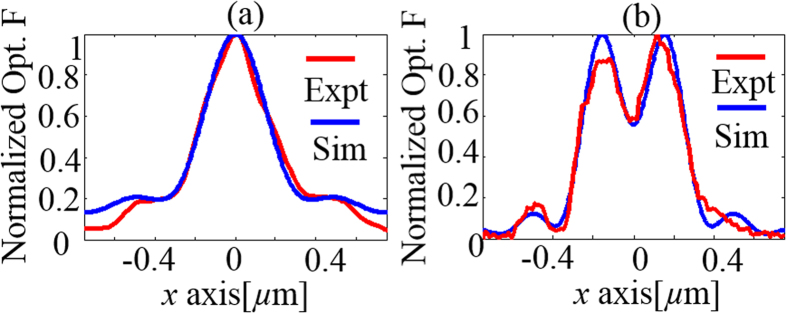
Figure 6.
(a) Comparison of line traces of normalized optical force obtained experimentally from curve b-b’ in Fig. 3 (a) and numerical calculations obtained by evaluating (1) showing good agreement. (b) Comparison of line traces of normalized optical force obtained experimentally from curve e-e’ in Fig. 3 (d) and numerical calculations obtained by evaluating (1) showing good agreement for the same value of ratio used to obtain fit in Fig. 6 (a).

