Fig. 1.

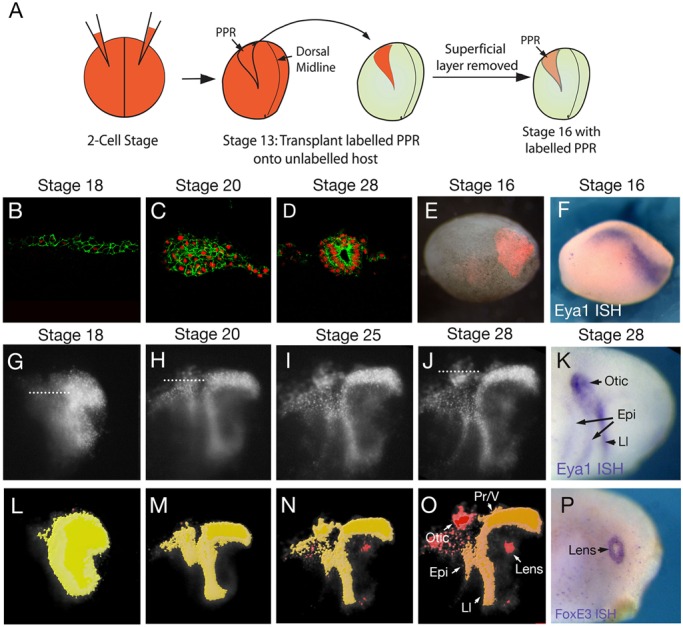
Time-lapse imaging reveals the gradual emergence of sensory placodes. (A) A schematic summarising the grafting technique. (B-D) Sections of PPR grafts injected with nRFP and mGFP in the otic region at the level indicated in G,H and J respectively. Cell outlines and nuclei are clearly visible, allowing visualisation of placode assembly. (E) Overlay of fluorescence and bright field image to reveal grafted cells at stage 16. (F) Eya1 expression at stage 16. (G-J) Lateral images of nRFP labelled grafts between stages 19 and 28. Dotted lines in G,H,J indicate positions of sections shown in B-D. (K) Eya1 expression at stage 28. (L-O) Automatically segmented regions of coherent cell labelling, colour-coded according to surface area, with a shift from yellow to red as the area decreases. Gradual segregation of placodal cells was observed in 8/8 grafted embryos. Arrows in (O) highlight individual placodes. (P) Expression of FoxE3 at stage 28. Epi, epibranchial; Ll, lateral line; Pr/V, Profundal/trigeminal placodes.
