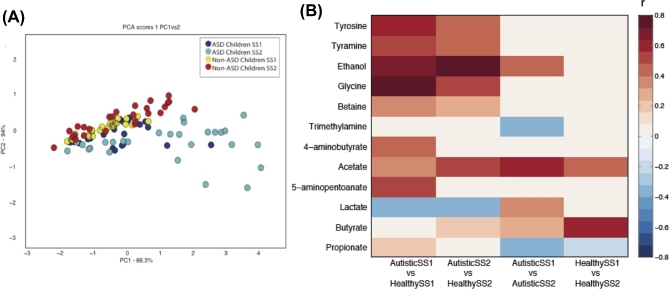
Figure 3.
1H-NMR data analysis. (A) PCA score plot shows a separation between models inoculated with stool samples of non-ASD and ASD children after administration of B-GOS. Dark and light blue dots represent replicates of samples from gut models inoculated with faecal samples of autistic children, before (SS1) and after (SS2) treatment, respectively. Yellow and red dots represent replicates of samples from gut models inoculated with faecal samples of non-autistic children, before (SS1) and after (SS2) treatment, respectively. (B) Correlation coefficients indicating the associations of identified metabolites with autism and their alteration upon B-GOS administration. SS1: before treatment; SS2: after treatment. White cells represent no significant correlations.

