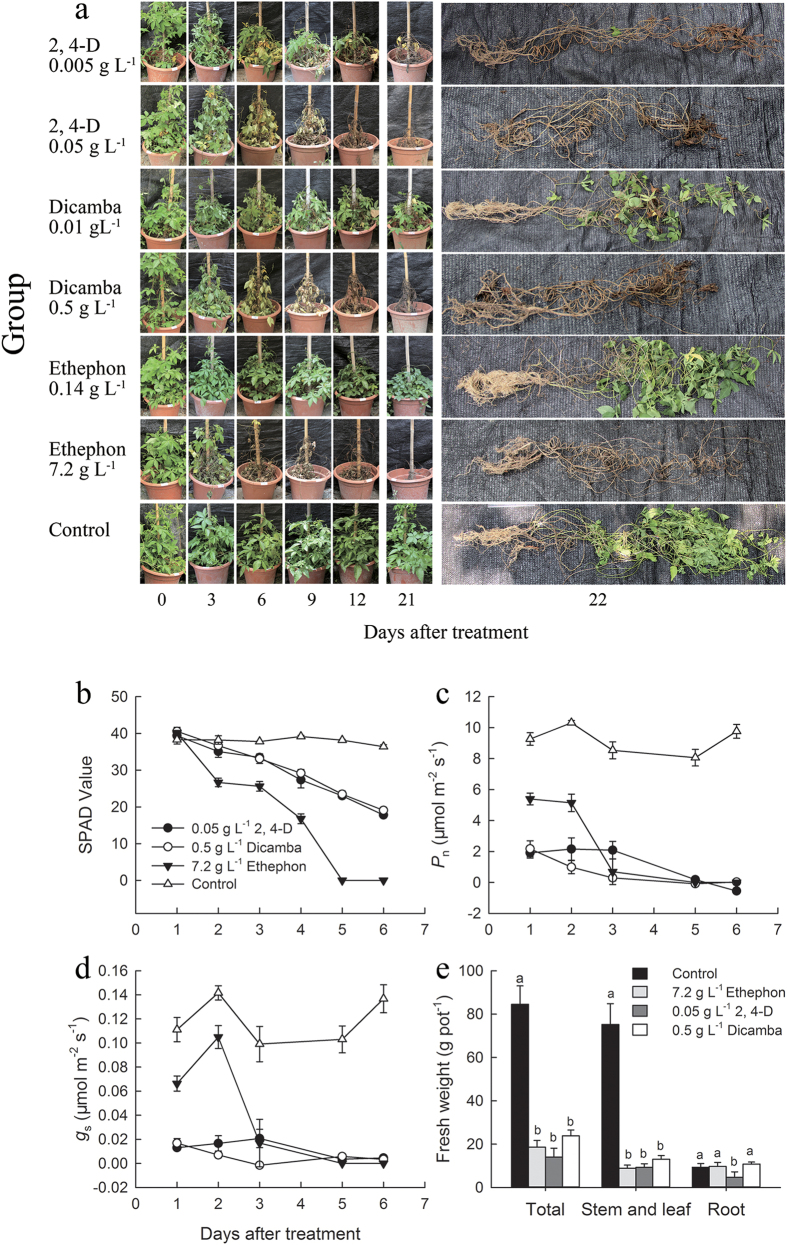
Figure 1.
The change in phenotype (a), chlorophyll content (SPAD value, (b), net photosynthesis rate (Pn, c), stomatal conductivity (gs, d) and fresh weight (e) of Ipomoea cairica in a pot experiment. Data are means ± SE. The columns with different letters are significantly different with each other (p < 0.05).

