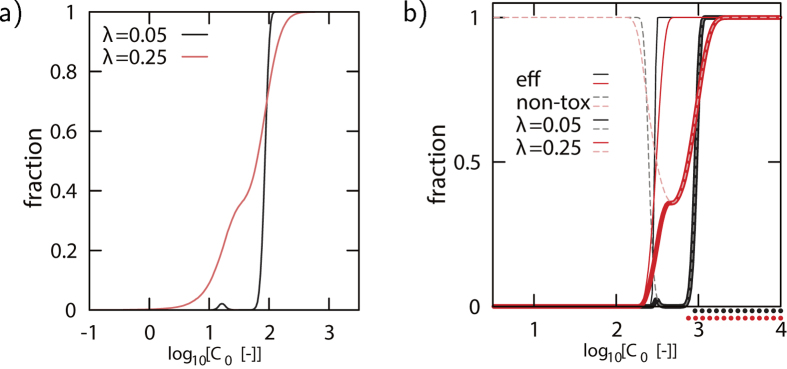
Figure 4. The effect of intrinsic variability in the 6 node network from Fig. 1b.
3. α = 0.5, n = 2. A relative change λ in all the intrinsic parameters (see Eq. (2)) leads to a reduction of the effectiveness and/or an increase in the toxicity. Shown is the fraction of parameter combinations for which a drug with concentration C0 is effective and non-toxic. a) Lines show for an agonist for S1 (with S2 = 200) the fraction of individuals for which—at the given dose C0—an effective and non-toxic treatment is obtained. b) Similar results for an agonist for V, however the results for effectiveness (thin lines) and non-toxicity (thick lines) are shown separately. The solid thick lines indicates the dose for which the drug is non-toxic and effective. The dotted thick lines denotes the therapeutic window (S1 = 0.1,S2 = 200).

