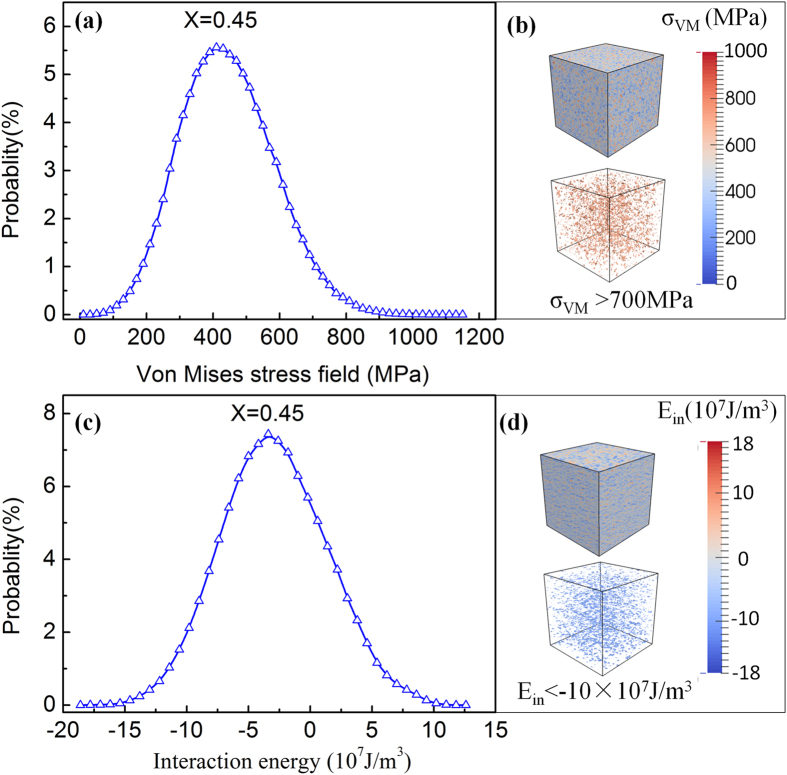
Figure 3.
(a) Distribution probability of local von Mises stress values generated by the point defects; (b) spatial distribution of local von Mises stress field σVM and the region with σVM > 700 Mpa ; (c) Distribution probability of the values of elastic interaction energy between the point defects and martensitic variant 1; and (d) spatial distribution of the elastic interaction energy Ein and the region with Ein > −10×107 J/m3.

