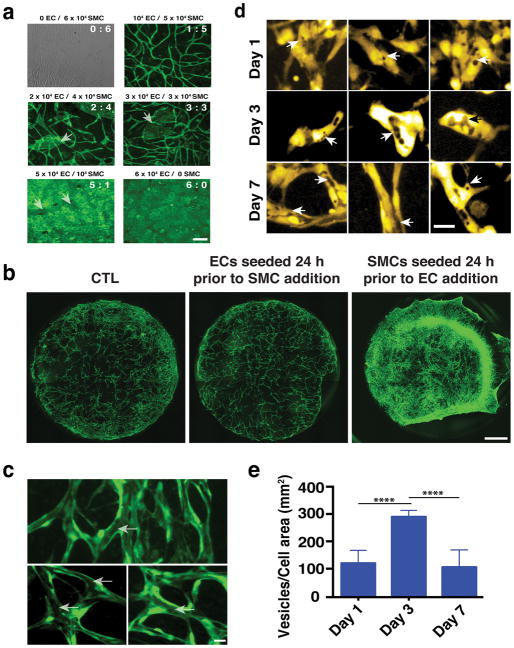
Fig. 2.
Development of vascular networks. a) Micrographs illustrating the resultant vascular network when the ratio of ECs to SMCs changes. Vessels are shown in green. Scale bar is 50 μm. b) Live imaging of vascular network formation at Day 3 in culture following different seeding conditions. ECs are shown in green, while for reasons of clarity SMCs are not labelled. Scale bar, 1 mm. c) Vessels that form in the EC-SMC co-culture contain contiguous lumens (arrows) that extend throughout the network (three different examples are shown). Scale bar, 30 μm. d) Lumen formation by vesicle fusion. At Day 1 VVO structures (arrows) develop within individual endothelial cells. Significantly more VVOs were observed on Day 3; by Day 7, extensive fusion of these structures creates the lumens. Three different image fields are shown for each time point. e) VVO quantification shows that the number of individual vesicles was highest on day 3; after this, fusion reduced the number on distinct structures. Scale bar, 30 μm.

