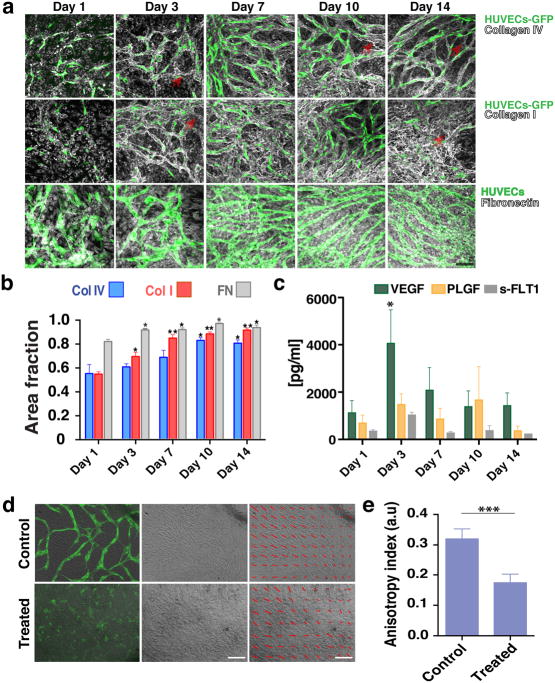
Fig. 3.
Co-cultures define their own microenvironment. a) Top row: Confocal immunofluorescence analysis revealed significant collagen IV (grey) staining around the vessel network (green) at Day 3. By Day 10 collagen IV had completely ensheathed the vessel network. Middle row: Collagen I (grey) was also produced and showed a similar peri-endothelial localization pattern in co-culture. Bottom row: Fibronectin (grey) was also abundantly produced by the co-cultures. Scale bar, 50 μm. b) Collagen I, collagen IV and fibronectin levels increased over time in EC-SMC co-cultures (assessed by the fractional area of staining in the IHC images). Error bars are standard errors from n = 3. c) ELISA results show a significant increase in VEGF levels at Day 3. s-FLT1 and PLGF were more constant. d) Top row: collective alignment of the SMCs was associated with vessel network formation and is apparent in the bright field image, At right: brightfield only; at left: brightfield with overlay of HUVECs (green). Bottom row: In fibronectin-treated wells (FN), SMCs form a non-aligned monolayer, and vessel network formation is minimal (bottom row, superimposed HUVECs-GFP). The SMC alignment is highlighted with red arrows in the last column. Scale bar, 150 μm. e) Measurements of the anisotropy index showed the loss of directionality of the SMCs. Control co-cultures at Day 3 have an anisotropy index of 0.32 ± 0.01, while fibronectin-treated co-cultures have a significantly lower anisotropy index (0.17 ± 0.01).

