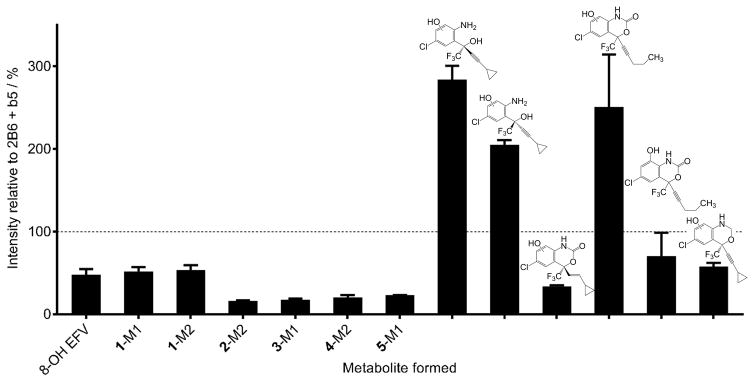
Figure 5.
Comparison of metabolite formation by CYP2B1 and CYP2B6. CYP2B1 or CYP2B6 (10 nM) were incubated with EFV or EFV analogues (10 μM) in the presence of an NADPH regenerating system for 30 minutes and the formation of the indicated metabolite measured by uHPLC-MS or uHPLC-UV (5-M1 only). Mean metabolite peak height from three independent incubations with CYP2B6 was set at 100% (represented by a dashed line). Values in the graph represent the metabolite formed by CYP2B1 in three independent experiments and are expressed as a mean percent of metabolite formed by CYP2B6 ± SEM.

