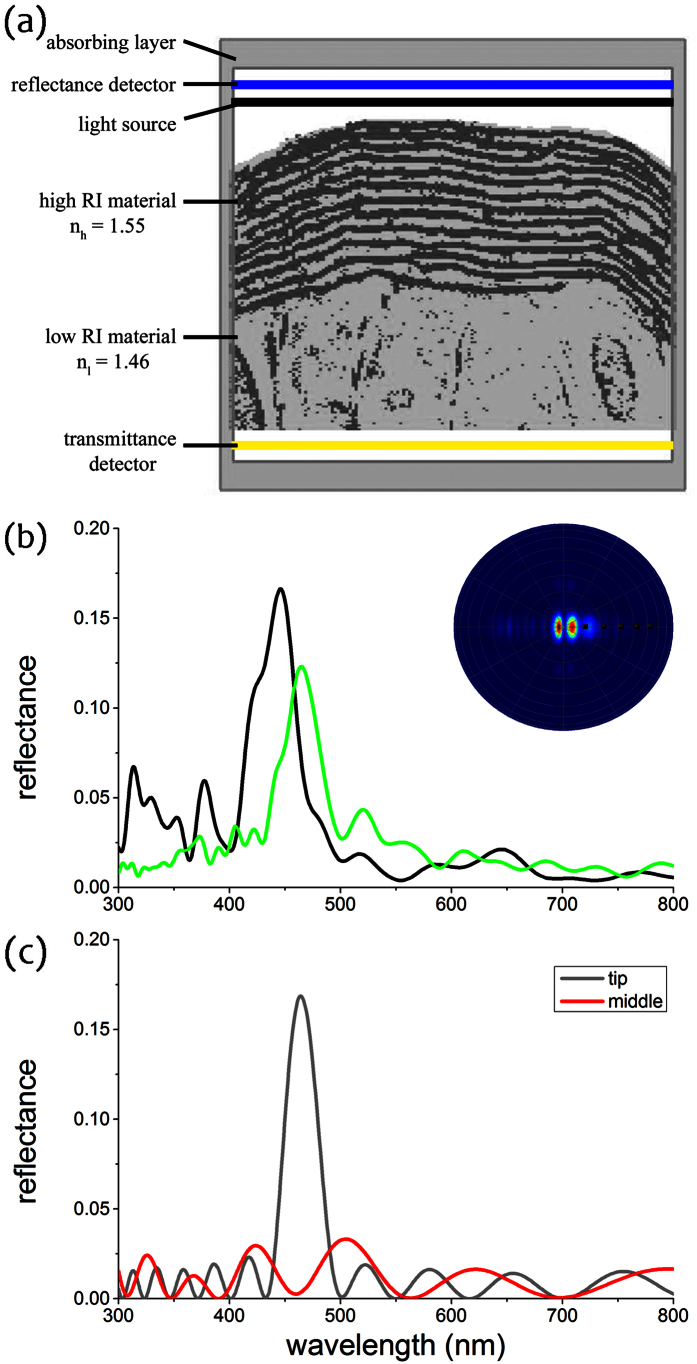
Figure 4. FDTD simulations.
(a) Binarized version of the TEM image in Fig. 2a in the modelling volume assigned in the FDTD simulations. The light cellulosic material was assigned a refractive index of 1.46, whereas the dark-stained material was assigned a refractive index of 1.55. The boundary box was filled with water, RI = 1.33 (see also Materials & Methods). The outlined area indicates the computational domain with absorbing boundaries, the black bar the position of the light source and the blue and yellow bars the reflectance and transmittance detector, respectively. (b) Simulated reflectance spectra for non-polarized light at normal incidence from FDTD simulations of two different TEM images (green line for structure of Figs 2a and 4a; black line for structure of another TEM image). Inset: Simulated light scattering pattern shows a strong directionality of reflected light. (c) Reflectance spectra of an idealised classical multilayer model for the structure in the tip (gray line) and the middle of the frond (red line).

