
Figure 3. Representative TA MSD plots of intracellular particle trajectories in A. castellani.
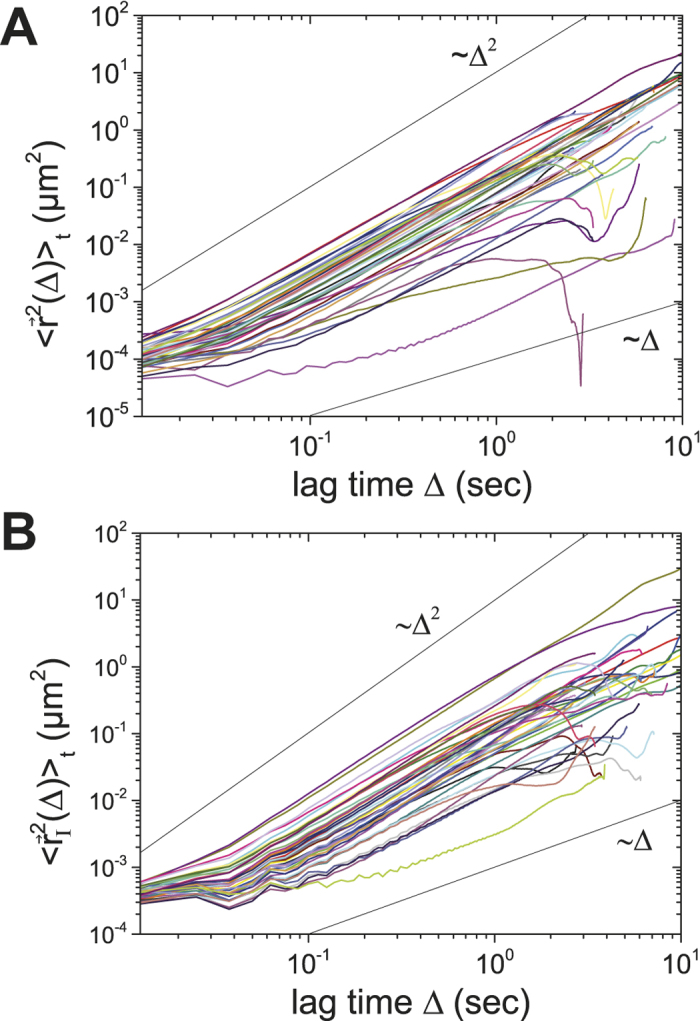
(A) TA MSD of intracellular particles. Most of the particles show superdiffusive motion with a diffusion exponent close to α ~ 2. (B) TA MSD of particle trajectories relative to the centroid of the acanthamoeba. Colors shown here are consistent with the colors used for the tracks in Fig. 2.