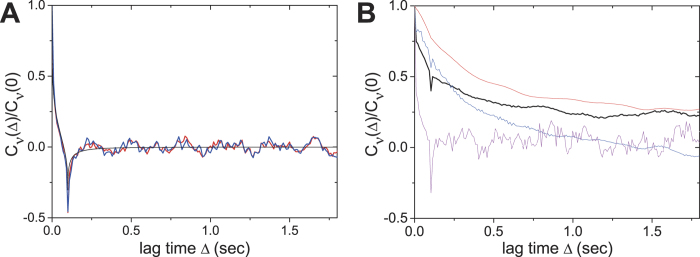
Figure 6.
Velocity autocorrelation function for intracellular particles in a blebbistatin-treated acanthamoeba (A) and after 1 h of recovery from inhibitor treatment (B). (A) Blue and red lines correspond to VACFs of particle trajectories. The black line denotes the theoretical VACF curve for FBM with α = 0.2. (B) Red, blue and grey lines show different types of VACFs received from the trajectory analysis. The black line denotes the average of 37 analyzed trajectories.

