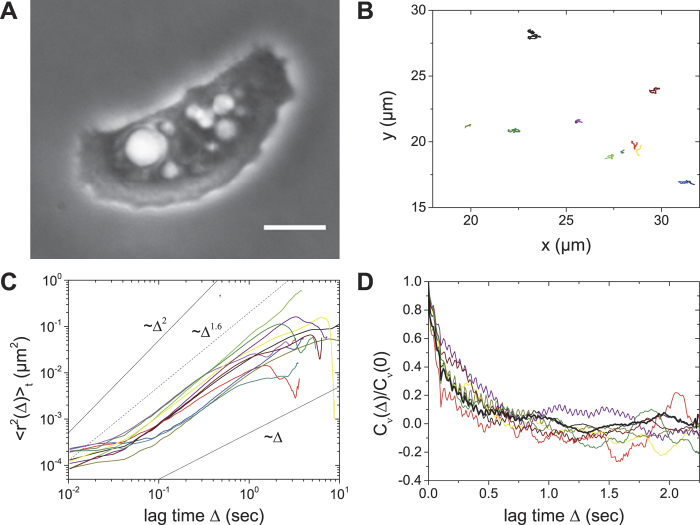
Figure 7. Intracellular particle motion in an acanthamoeba treated with 5 μM latrunculin A.
(A) Phase contrast image. Scalebar: 10 μm. (B) 2D intracellular particle trajectories of the acanthamoeba shown in A. The tracks do not show strong directionality. (C) TA MSDs reveal superdiffusion. (D) Velocity autocorrelation function for selected representative trajectories. The bold black line denotes the average of 13 analyzed trajectories.

