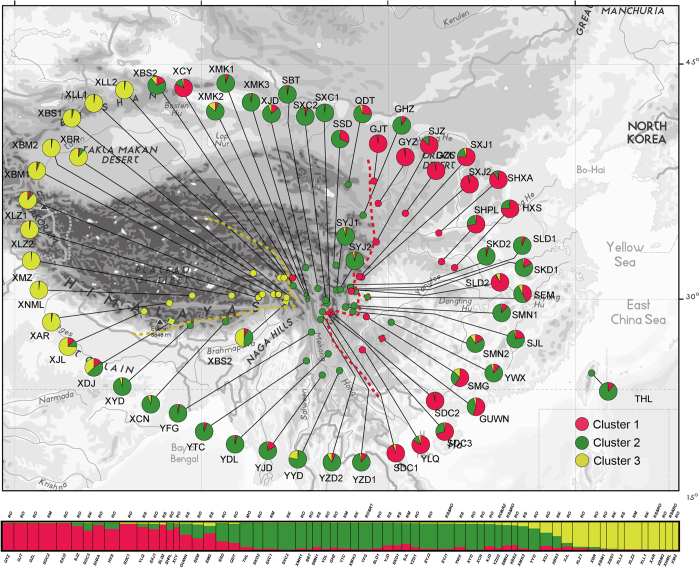
Figure 2. Geographic origin of the 62 R.sericea complex populations and their colour-coded grouping according to the STRUCTURE analysis.
Population codes are identified in Table 1. The bottom showed a histogram of the STRUCTURE assignment test for 62 populations (763 individuals) of R. sericea complex based on variation at eight nuclear microsatellite (nSSR) loci. Population codes and abbreviation for species are identified in Table 1. The map generated by ESRI ArcGIS 9.3 (ERSI co., USA).

