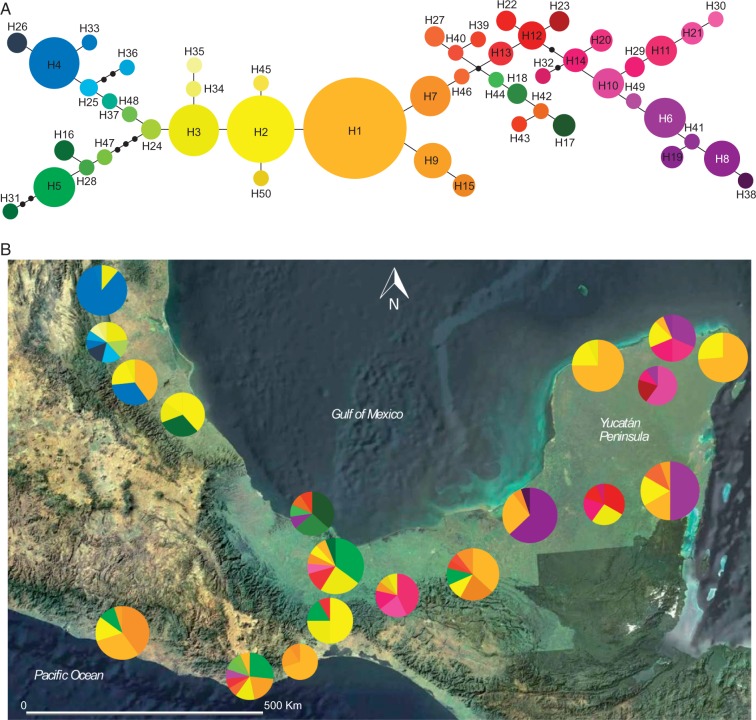
Fig. 4.
(A) Statistical parsimony haplotype network for the psbA-trnH chloroplast region of Carica papaya. The size of circles is proportional to the frequency of each haplotype, and small black circles represent non-sampled haplotypes. (B) Geographical distribution of 19 natural populations of C. papaya cpDNA haplotypes in south-eastern Mexico. Pie charts represent the haplotypes found in each sampling locality. The area of the pie chart represents the size of the population and the size of sections is proportional to the haplotypic frequency.

