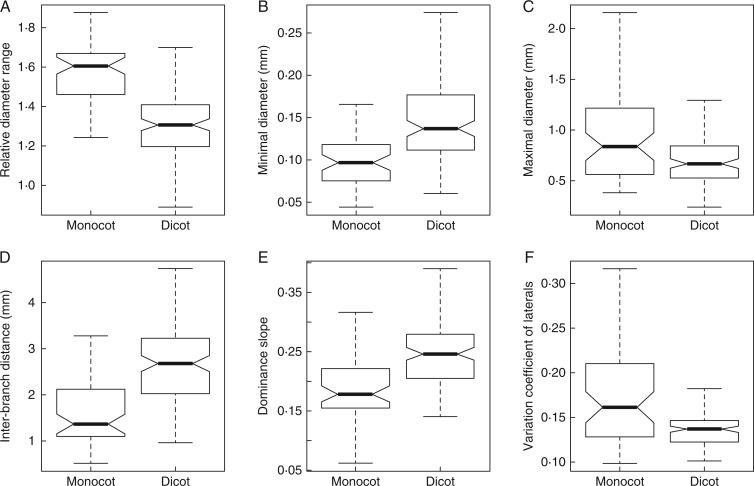
Fig. 3.
Boxplots showing the distribution of the traits between the two sub-populations [monocots (n = 57) and dicots (n = 121)] among all SE (i.e. Species in a given Environment). Horizontal lines represent quantiles at probability levels of 0·05, 0·25, 0·50, 0·75 and 0·95. Notches in the boxes represent the confidence intervals on the medians.

