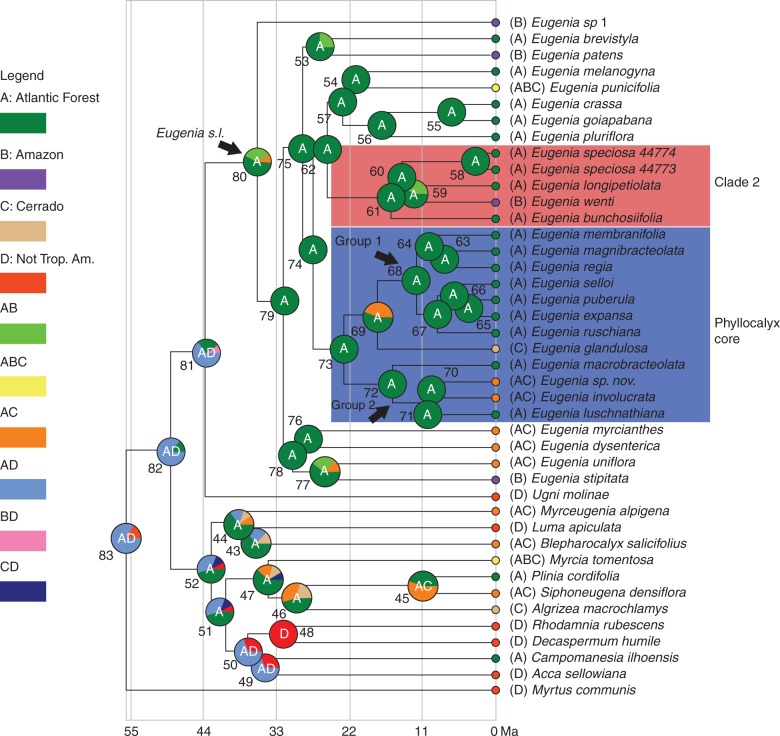
Fig. 2.
Ancestral area analysis (DEC) represented on the maximum credibility tree. Letters within the pie charts are the single or pair of most probable ancestral areas (A, Atlantic forest; B, Amazon forest; C, Cerrado; D, ‘non-tropical America’. Numbers adjacent to the pie chars identify each node. The range of each species is listed in parentheses next to the species name.

