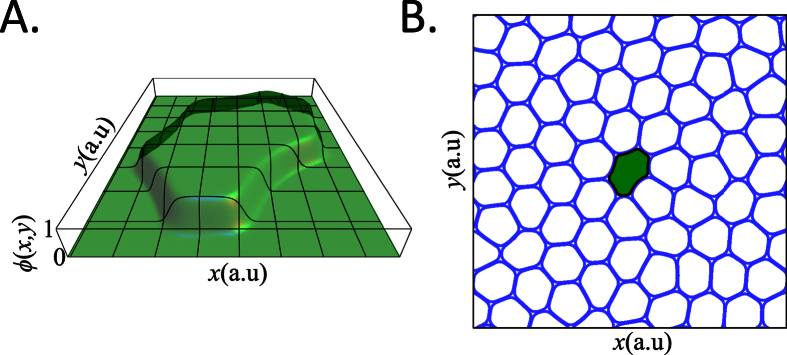
Figure 1. An example of a model monolayer comprising one soft cancer cell and normal cells.
Each cell is described by a field, ϕ(x, y), that is defined to be 0 outside the cell and 1 inside. The field rapidly varies in the region of the cell boundary. A. The field of a single cancer cell. B. The monolayer is reconstructed by showing the boundary of all cells (Blue curves). A tagged cell, the cancer cell, is filled in Green with a Black boundary.

