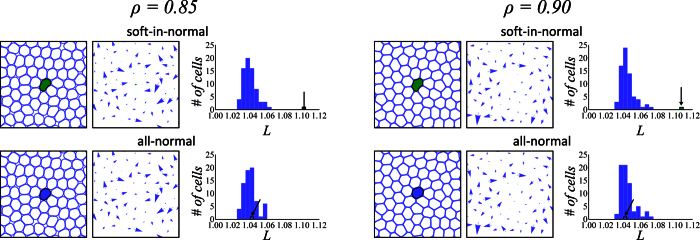
Figure 2. Summary of the aging simulations.
The results of the four aging simulations are shown as groups of three panels. The left panel in a group shows the monolayer configuration after aging. The tagged cell is filled in Green (Blue) when it is a soft cancer (normal) cell. All other cells are normal and their boundaries are shown in Blue. The middle panel shows the displacement of each cell relative to its initial position. The right panel shows the distribution of the cell perimeter, Ln (see Eq. (3)), after aging. The arrow points toward the tagged cell. The left and right groups of three panels respectively correspond to the packing fractions ρ = 0.85 & 0.9 and the top and bottom groups respectively correspond to the soft-in-normal and all-normal cases.

