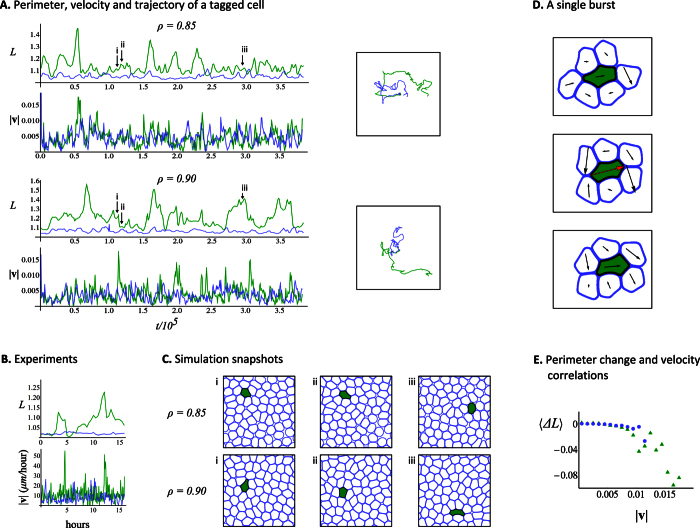
Figure 3. Summary of motile cells simulations.
(A) The perimeter and instantaneous velocity, L and  , of the tagged cell as a function of dimensionless time. Green corresponds to the soft cancer cell (soft-in-normal simulations) and Blue corresponds to its normal counterpart (all-normal simulations). The top (bottom) two panels report the simulation results obtained with ρ = 0.85(0.90). The total simulation time corresponds to ≈40 hours when converted back in real time (see the Methods section). The two boxes show the trajectories of the tagged cells at the two packing fractions. (B) Experimental results reproduced with permission from Ref. 9 for a monolayer that comprises very few cancer cells and mostly normal cells. The value of L is calculated from the deformation of the cell nucleus and the total observation time is 16 hours. (C) Snapshots of the motile soft-in-normal monolayer simulations at ρ = 0.85 (top) and ρ = 0.90 (bottom) that correspond to the times indicated by the labels i, ii and iii in part A. (D) Three snapshots of the soft-in-normal simulation at ρ = 0.90 are shown at times just before, during, and right after the speed burst right after the label iii in part A. Only the soft cancer cell (filled in Green) and its neighbors (Blue boundaries) are shown. The length of the Black arrow on top of each cell is proportional to its instantaneous velocity. When collective effects between cells induce a speed burst to the soft cancer cell (i.e., when its instantaneous velocity is larger than the active part), the arrow is shown in Red. (E) Average change in cell perimeter, ΔL, between succesive time steps binned according to the cell instantaneous velocity,
  . Note that part A and D have accompanying supplementary movies.

