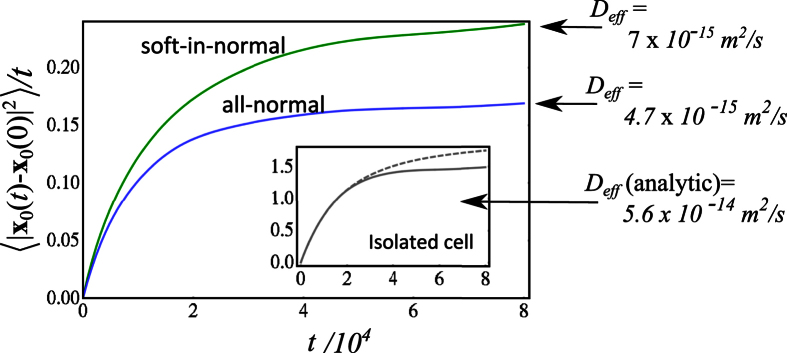
Figure 5. Motility of motile cells in monolayers.
The mean-squared displacement of the tagged soft cancer in the soft-in-normal simulation (Green curve) and of the normal tagged cell in the all-normal simulation (Blue curve) are reported at the largest packing fraction (ρ = 0.90). The effective diffusion coefficients that characterize the migration potential of the tagged cell were calculated from the long-time limit of the mean-square displacement and converted back to real units. The inset shows the mean-squared displacement calculated from the simulation of a cell isolated on the substrate (full curve) and compares it with the analytical prediction (dashed curve) given by Eq. (14).

