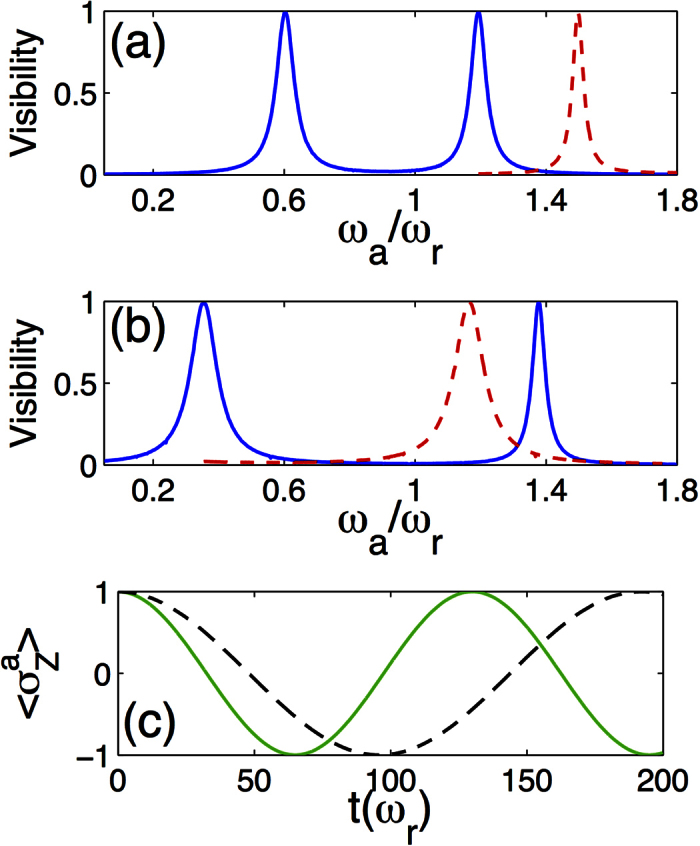
Figure 4. Spectroscopic protocol and real time dynamics.

(a,b) Numerical simulation of the spectroscopy protocol. Visibility of the ancilla population oscillations as a function of frequency ωa. Physical parameters correspond to the vertical cuts in Fig. 2. For both (a,b), the system qubit frequency is ω/ωr = 0.8 and the ancilla-field cavity coupling is ga/ωr = 0.02. The USC system coupling is g/ωr = 0.3 for (a) and g/ωr = 0.6 for (b). The parity of each energy level is identified, blue continuous line for odd and red-dashed lines for even states. (c) Comparison of full model (green continuous line) to the dynamics obtained when removing counter-rotating terms from the ancilla-cavity interaction (black dashed line). System parameters are the same that in box (b). In all cases, decay rates are γ/ωr = 10−3 for the system qubit, γr/ωr = 10−4 for the cavity and γa/ωr = 10−4 for the ancilla.
