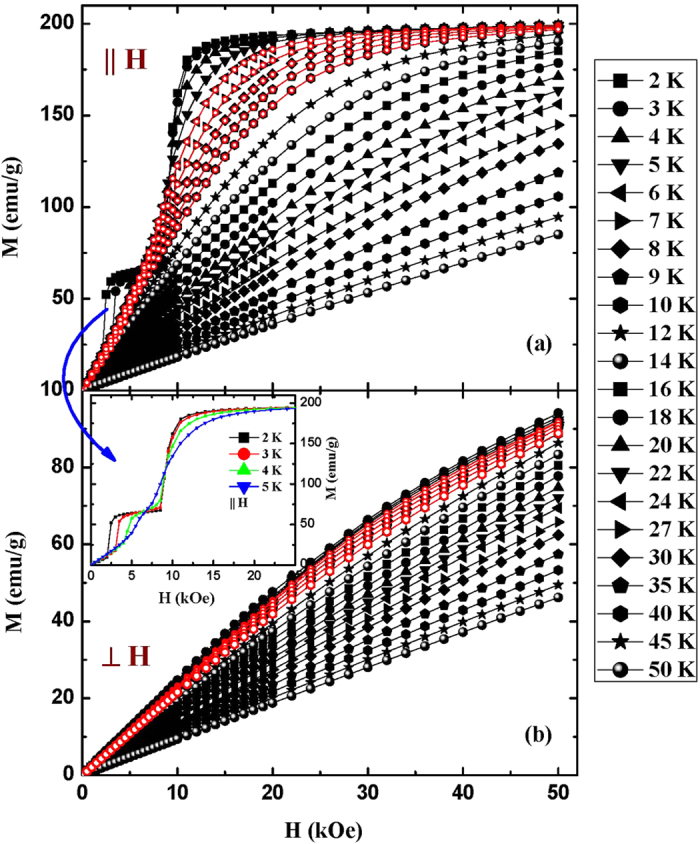
Figure 3.

Magnetization isotherms of DyNiSi along parallel (a) and perpendicular directions (b) respectively. The isotherms with red circles around TN indicate the M-H curves measured in field decreasing mode. The inset shows the magnetization isotherms along parallel direction in the temperature range of 2–5 K at low magnetic fields.
