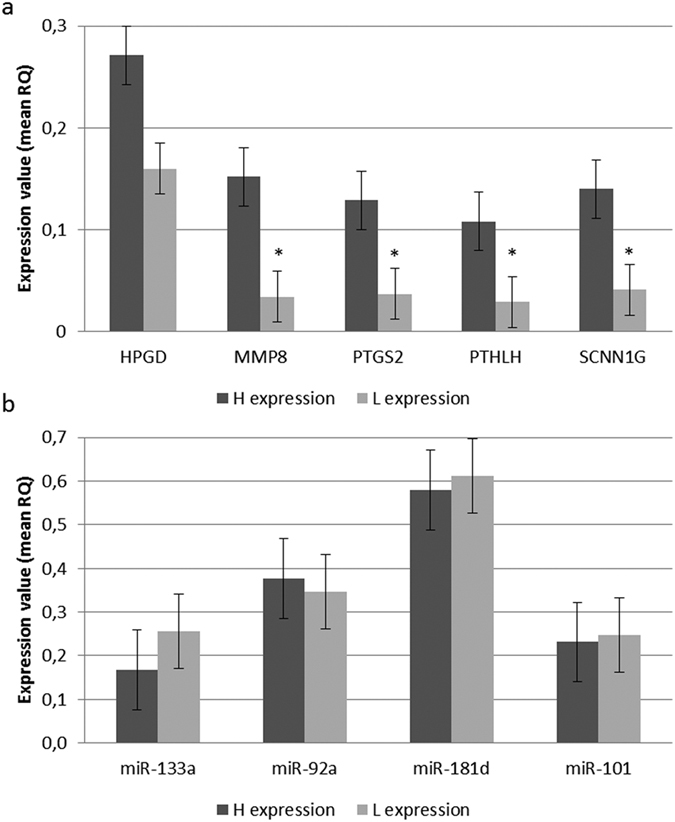
Figure 1.

(a) RT-qPCR analysis results for gene expression. Expression values were calculated applying the −2∆∆CT algorithm. Estimated relative quantities were normalized for the expression value of two uterus endogenous genes B2MG and UBC and calibrated to the sample with a higher expression. Significance was set at a p-value < 0.05 (*). (b) RT-qPCR analysis results for miRNA expression. Relative quantities were calculated using target-specific amplification efficiencies and normalized for the expression level of two uterus reference miRNAs: has-miR-93 (M = 0.464; CV = 0.156 and ssc-miR-103 (M = 0.464; CV = 0.166).
