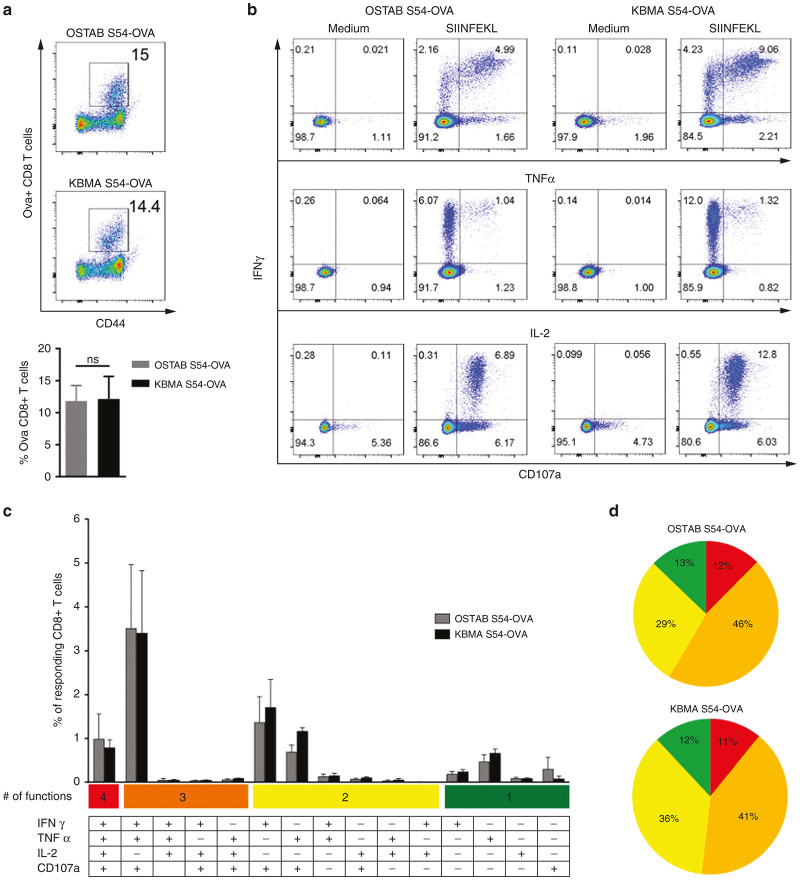
Figure 1.
Functional characterization of splenic Ova-specific CD8+ T cells response 10 days after last immunization. (a) Representative flow cytometric profile (up) and frequency (down) of Ova-specific CD8+ T cells evaluated by H2Kb-SIINFEKL multimer staining on total CD8+-gated cells (b) Simultaneous production of the cytokines IFN-γ, TNF-α, and IL-2 by CD8+ T cells as well as degranulation (CD107a) marker were assessed during 4 hours OVA peptide (SIINFEKL) stimulation or in absence of stimulation (Medium). (c) Frequency of total CD8+ T cells allocated in each of the 15 analyzed combinations of IFN-γ, TNF-α, IL-2, and CD107a marker according to the diagram shown underneath the bar graphs. (d) Pie charts represent the spectrum of functions (cytokines and/or degranulation marker) among responding CD8+ T cells to OVA peptide stimulation, in KBMA and OSTAB groups. Each slice of pie represents the percentage of cells expressing between 1 and 4 effector functions. Mean ± SEM. IFN-γ, interferon-γ; IL-2, interleukin-2; KBMA, killed but metabolically active; TNF-α, tumor necrosis factor-α ; SEM, standard error of the mean.

