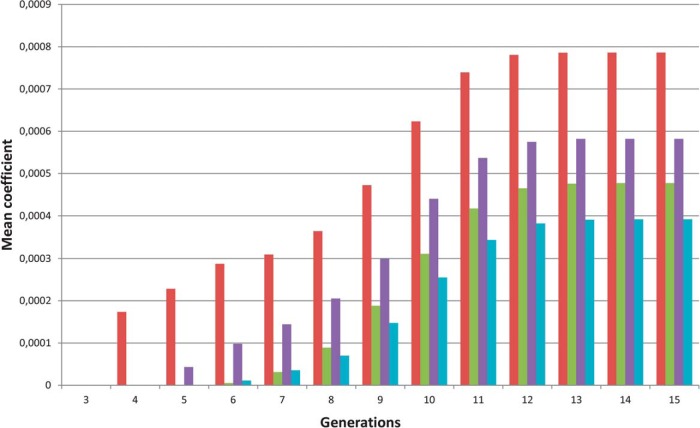
Figure 2.
Mean kinship coefficients for the SDHC carriers (red bars) and for the three groups of controls (controls 1, green bars; controls 2, purple bars; controls 3, blue bars). Starting at generation 4, the kinship coefficients were higher in the group of SDHC carriers compared with the three control groups, indicating that the index cases are more related than the control groups.

