Figure 1.
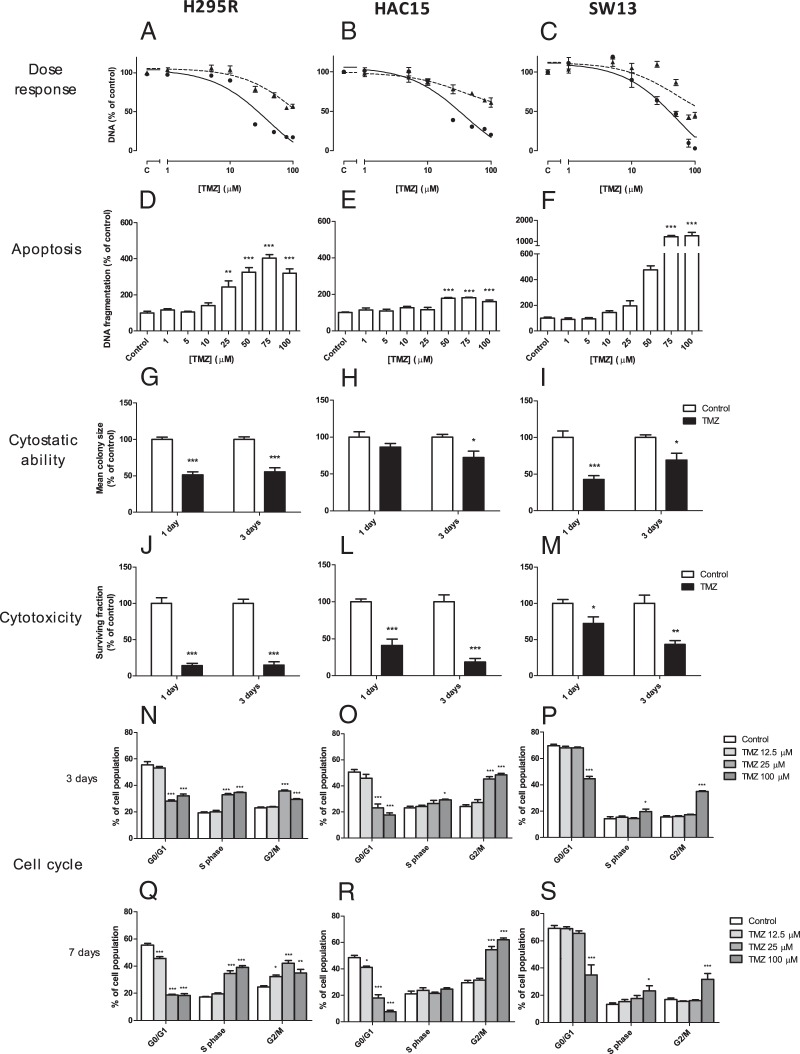
Effects of TMZ treatment on H295R, HAC15, and SW13 cells on cell amount expressed as DNA content (A–C), apoptosis expressed as DNA fragmentation (D–F), cytostatic ability expressed as mean colony size (G–I), cytotoxicity expressed as surviving fraction of colonies (J–L), and effect on cell cycle analysis after 3 (M–O) and 7 days (P–R) of treatment with TMZ. In panels A–C, dotted and solid lines represent 3 and 7 days of treatment, respectively, and panel C on the y-axis represents the vehicle-treated control. Apoptosis was assessed after 3 days. For the colony-forming assay, 25 μM was used for H295R and HAC15 and 50 μM TMZ for SW13. Values represent mean ± SEM and are shown as a percentage of control. *, P < .05, **, P < .01, ***, P < .001 vs control. C, control.

