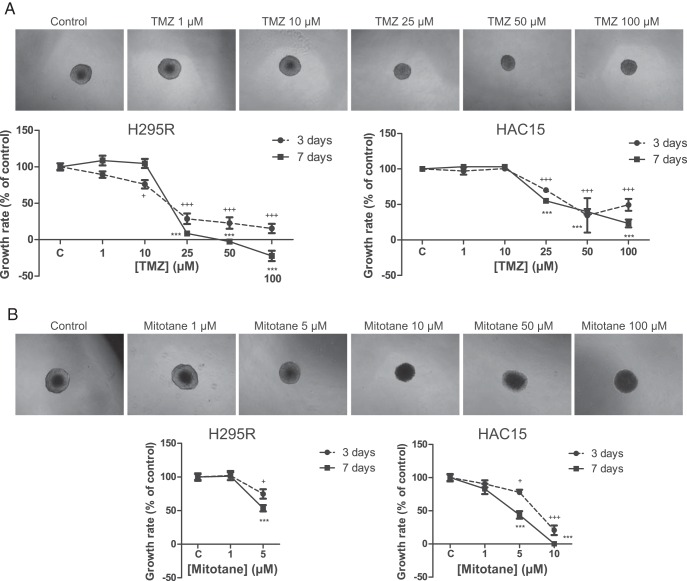
Figure 2.
Effect of TMZ and mitotane on ACC cells cultured as 3D multicellular spheroids. Effects of different concentrations of TMZ (A) and mitotane (B) on H295R (left panel) and HAC15 (right panel) spheroid growth rate compared with control. Photographs are taken after 7 days of treatment. After mitotane treatment, it was not possible to measure the spheroids in the highest concentrations (H295R, 10, 50, and 100 μM; HAC15, 50 and 100 μM) because there was no clear outer boundary of the spheroids visible. Negative numbers indicate shrinking of the spheroid. Values represent mean ± SEM. *, P < .05, **, P < .01, ***, P < .001 vs control. C, control.

