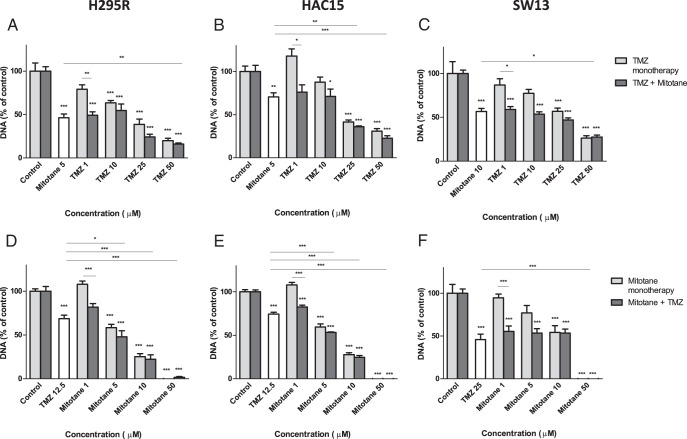
Figure 3.
Combined effect of TMZ and mitotane on cell number in H295R, HAC15, and SW13. Effect of different concentrations of TMZ with or without a fixed concentration of mitotane (5 or 10 μM) in H295R (A), HAC15 (B), and SW13 (C) is shown. Effect of different concentrations of mitotane with or without a fixed concentration of TMZ (12.5 or 25 μM) in H295R (D), HAC15 (E), and SW13 (F) is also shown. Cell number is depicted as total DNA amounts. Values are represented as mean ± SEM and are shown as a percentage of control. *, P < .05, **, P < .01, ***, P < .001 vs own control or as stated by the lines.

