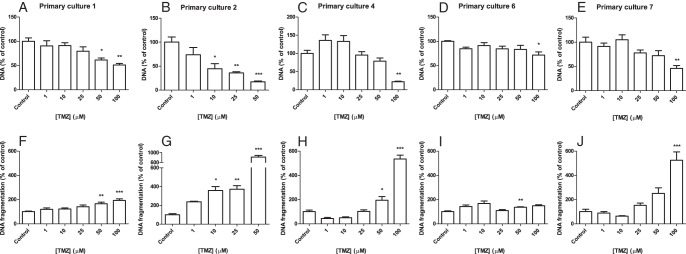
Figure 4.
Effects of TMZ on five of the eight primary ACC cultures that responded to TMZ by an inhibition of cell number (A–E) after 7 days of treatment and an induction of apoptosis (F–J). Cell number is depicted as amount of DNA and apoptosis as amount of DNA fragmentation. Two additional primary cultures showed induction of apoptosis but no inhibitory effect on cell number. One primary culture did not respond to TMZ by either a change in cell amount or apoptosis. Values represent mean ± SEM and are shown as percentage of control. *, P < .05, **, P < .01, ***, P < .001 vs control.

