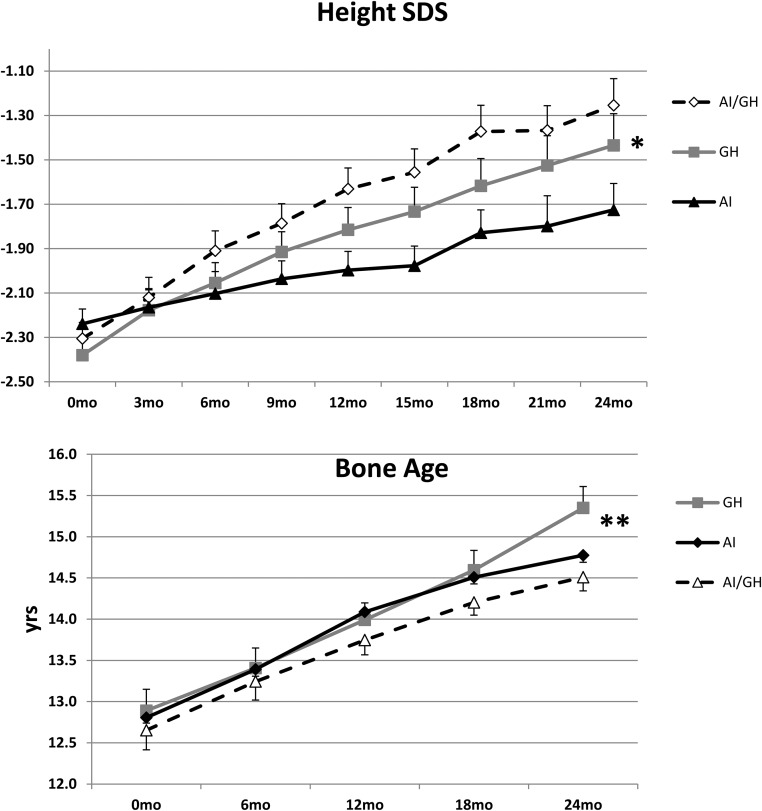
Figure 1.
Changes in mean (SE) height SDS (top panel) and bone age (bottom panel) over 24 months in the groups treated with AIs, GH, and AI/GH. *, P < .0012 (top panel); and **, P = .002 (bottom panel) represent the probability of difference in mean changes between groups for all parameters (ANCOVA). n = 76 (baseline), 72 (12 months), and 65 (24 months).

