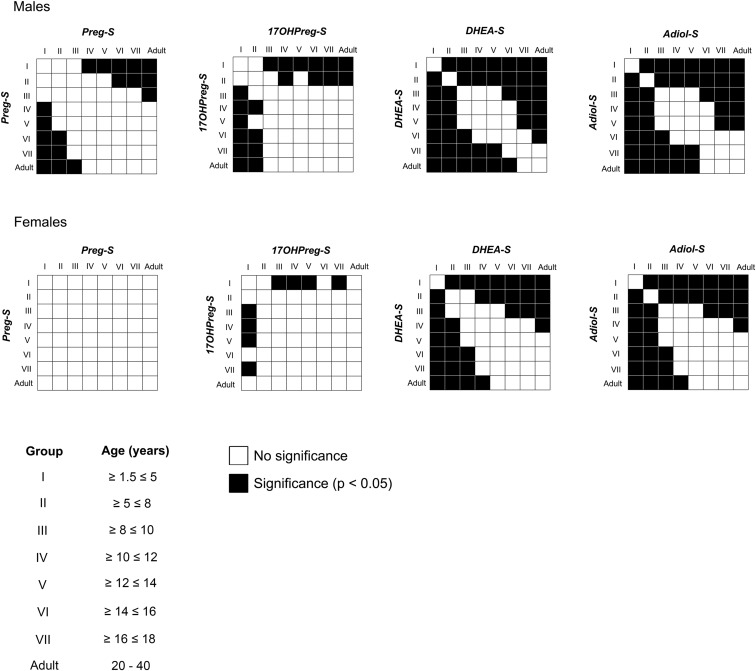
Figure 2.
Statistical comparison of serum steroid levels between different age groups. Statistical significance was determined by one-way ANOVA followed by the Tukey post-hoc test on transformed data and the comparison between all pairs of age groups was plotted as a correlation matrix. Black boxes indicate statistical significance between the two groups (P < .05) and white boxes indicate no significant difference.

