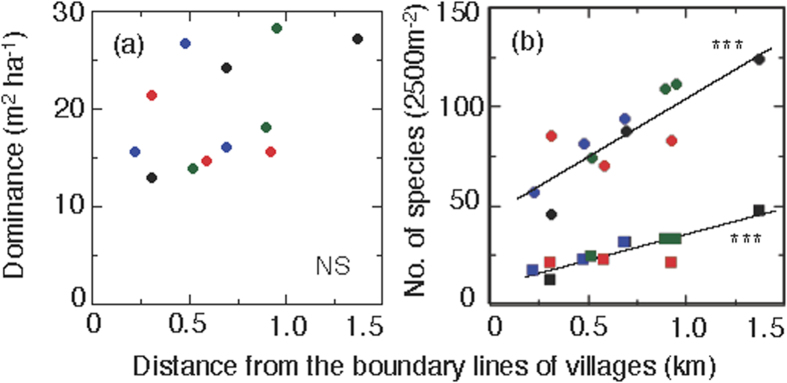
Figure 2. Relationship of dominance and the number of species according to the distance from village boundaries.
(a) Dominance (=total basal area 1 ha−1). (b) Numbers of species of all woody plants (circles) and medicinal plants (squares) plotted against the distance from the boundary lines of villages. The direction is indicated in plot colors for east (blue), north (black), south (red), and west (green). Statistical analyses showed that (a) is not significant (r = 0.479, NS), whereas (b) is significant for all woody plants (r = 0.855, P < 0.001) and for all medicinal plants (r = 0.868, P < 0.001). See Supplementary Fig. 2 and Supplementary Table 5 for more details on the plot positions.

