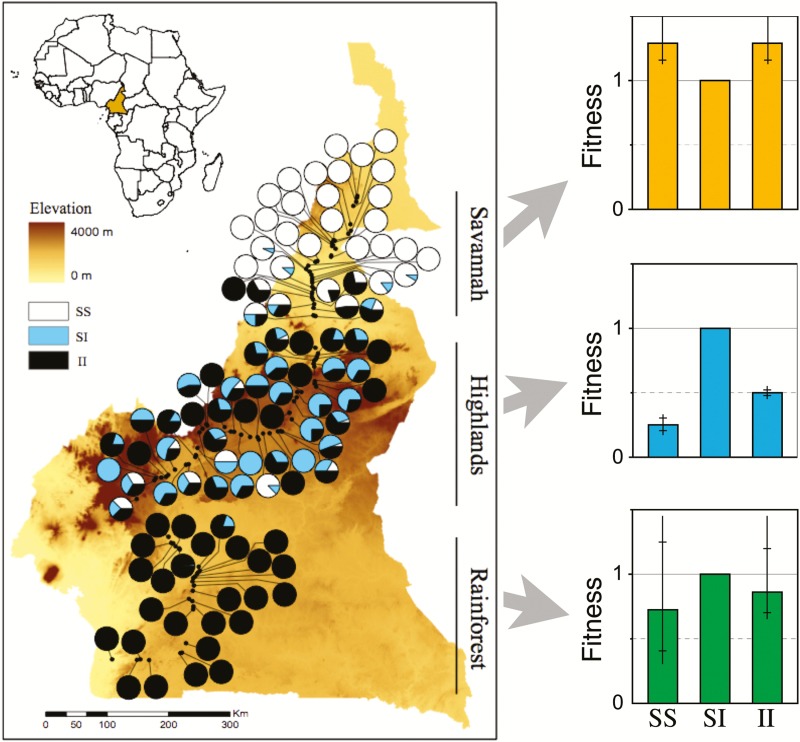
Figure 1.
Left: Inversion 2La in the malaria mosquito Anopheles funestus has a strong frequency cline in Cameroon. The pie diagrams show the frequencies of the 3 genotypes (S = standard chromosome, I = inverted chromosome). Samples are from 105 locations along a highway that traverses 3 ecological zones: savannah (north), highlands (center), and lowland tropical rainforest (south). Right: Estimates of relative viabilities for the 3 genotypes in the 3 zones estimated by fitting a spatially explicit genetic model to the data using likelihood. The bars and whiskers show the 95% and 99% confidence limits. From Ayala et al. (2013).

