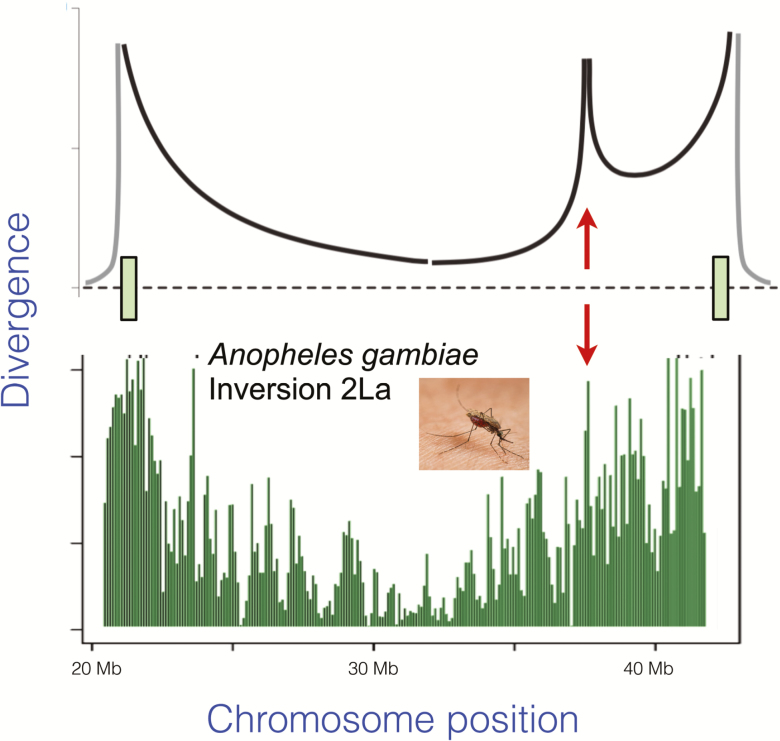
Figure 2.
Top: Coalescent simulations show that divergence between uninverted and inverted chromosomes will show a distinctive pattern. Divergence (measured as F ST or d xy) is highest at the breakpoints (indicated by the rectangles on the chromosome map at bottom). Locally adapted loci within the inversion (indicated by the arrow) will show additional divergence peaks. From Guerrero et al. (2012). Bottom: Divergence between standard and inverted chromosomes in the region spanned by inversion 2La in the mosquito Anopheles gambiae. The data are from pooled sequences of mosquitoes sampled from Cameroon from Cheng et al. (2012).

