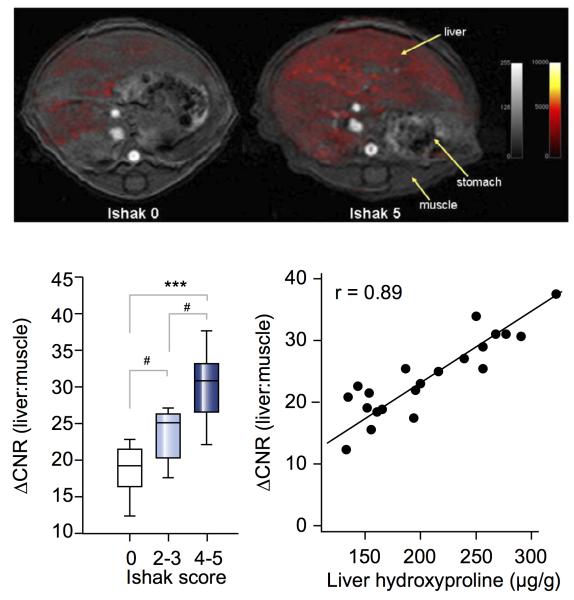
Figure 4.
Top: Axial T1-weighted image (4.7T) of liver in healthy control (Ishak 0, left) and severely fibrotic (Ishak 5, right) mice. False color scale depicts difference in liver to muscle contrast to noise (ΔCNR) ratio pre- and post-injection of EP-3353. Bottom Left: Correlation between ΔCNR and Ishak score. Bottom right: Correlation between ΔCNR and liver hydroxyproline concentration calculated ex vivo. Adapted with permission from reference 71.

