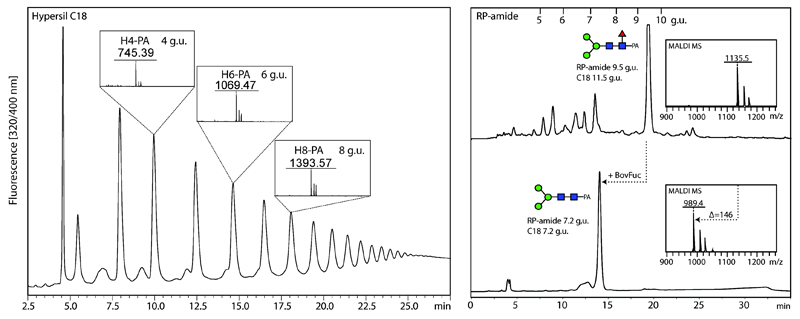
Figure 2. Examples of RP-HPLC separations.
RP-HPLC columns can be calibrated in terms of glucose units for day-to-day comparisons; the order of elution is the same as for NP-HPLC with the lowest molecular weight gluco-oligomers coming first as verified by MALDI-TOF MS of three of the standard peaks. Some modifications have also a major effect on elution times on RP-HPLC, as exemplified by the elution of Manα1,6(Manα1,3)Manβ1,4GlcNAcβ1,4(Fucα1,6)GlcNAc-PA before and after bovine α-fucosidase digestion, which results in a reduction in elution time from 9.5 to 7.2 glucose units on an RP-amide column (11.5 to 7.2 g.u. in the case of a standard C18 column); the example glycan shown is from Trichuris suis.(17)

