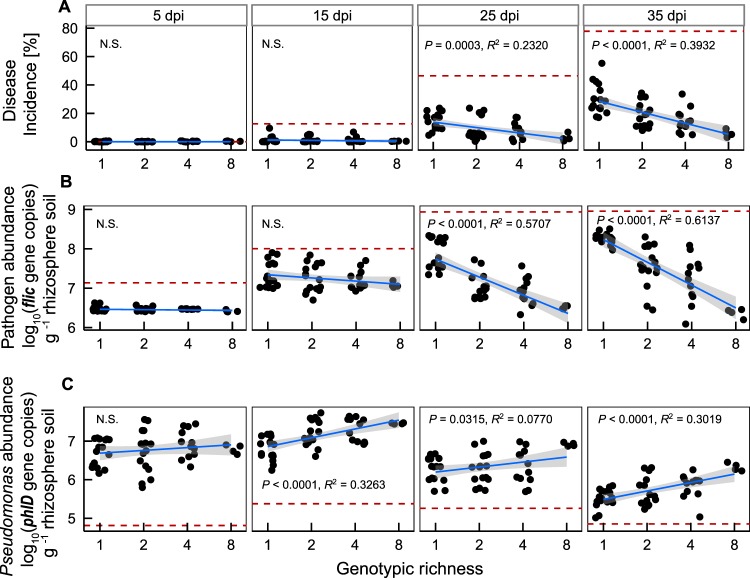
FIG 2 .
Characterization of biodiversity-ecosystem functioning relationships in vivo. (A) The dynamics of bacterial wilt disease incidence in Pseudomonas communities at different richness levels and at different points in time. (B) Pathogen density dynamics as affected by Pseudomonas communities with different richness levels. (C) Pseudomonas density dynamics in communities with different richness levels. Panel columns denote results at 5 days, 15 days, 25 days, and 35 days post-pathogen inoculation (dpi). The red dashed lines show the baseline for control treatments. In panels A and B, red dotted lines denote disease incidence and pathogen density in the absence of Pseudomonas bacteria; in panel C, red dashed lines denote Pseudomonas-specific phlD gene density in natural soil in the absence of introduced Pseudomonas bacteria.

