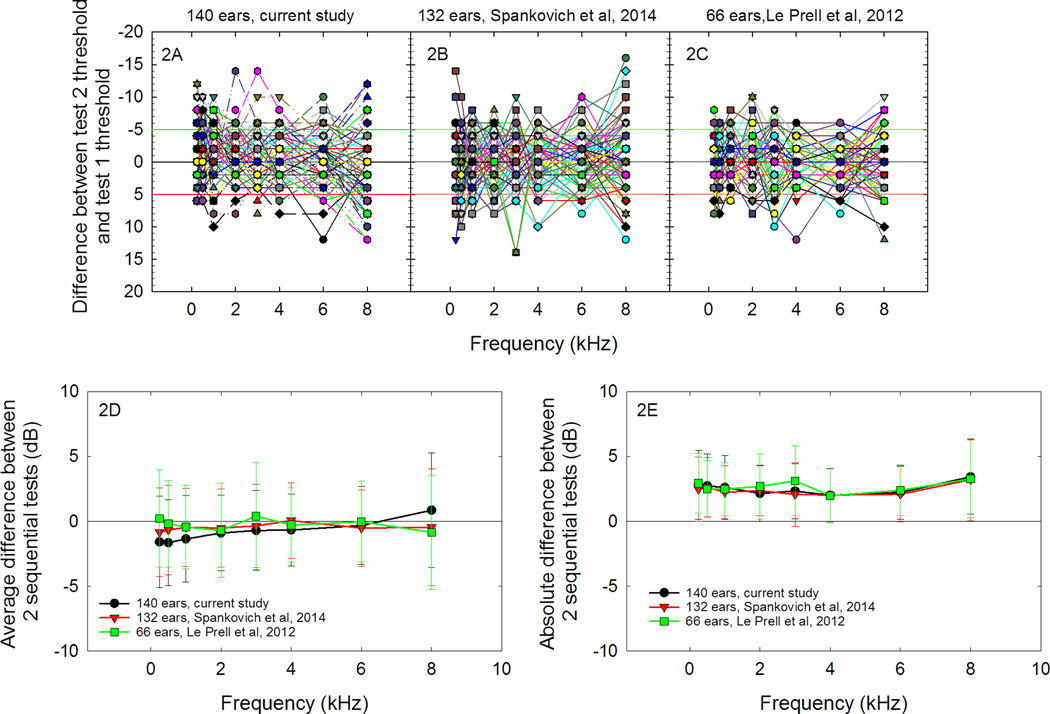
Figure 2.
Variability from test 1, completed at screening, to test 2, completed prior to the music exposure, is shown in Figure 2A. Negative values indicate performance was better on the second pre-music test; the green line indicates the conventional −5 dB reliability assumption. Positive values indicate performance was poorer on the second pre-music test; the red line indicates the conventional +5 dB reliability assumption. Reliability of the 70 subjects shown here was consistent with that reported for 66 subjects tested by Spankovich et al. [2014] (Fig. 2B) and that of the 33 subjects tested by Le Prell et al. [2012] (Fig. 2C). Because some symbols are hidden behind others, data value frequencies are listed in table 1. The average test-retest difference is near zero (Fig. 2D) as there are equal numbers of subjects that perform better, versus those that perform more poorly, on the second test. The average of the absolute value of the test to test difference is ~3-dB with standard deviations indicating that the majority of subjects are consistent within 5–6 dB from test to test.

