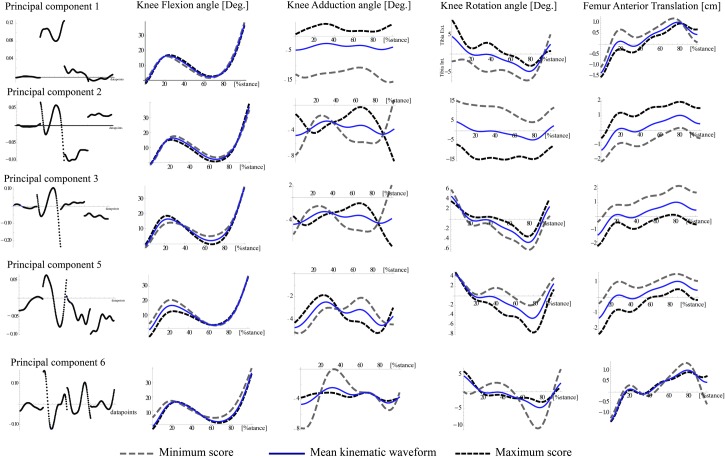
Fig 2. Waveforms were reconstructed using the maximum and minimum PC scores.
The far left column illustrates the principal components that represent a specific pattern of deviation from the mean trial vector (i.e. waveforms) and the right four columns illustrate nature of those deviations from the mean waveform (solid line) based on the maximum and minimum PC scores. Our interpretation of the nature of these deviations is listed in Table 2.

