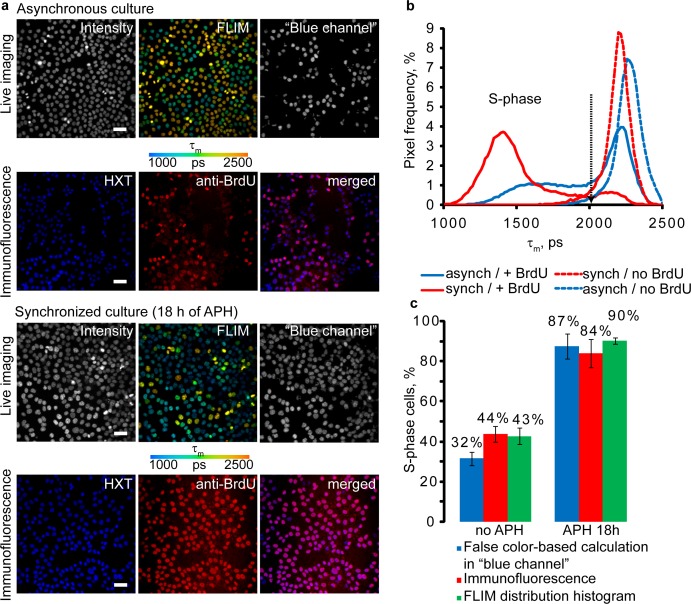
Fig 2. Comparison of FLIM and immunofluorescence methods of cell proliferation analysis.
(a) Asynchronous and synchronized live HCT116 cells were incubated with BrdU (100 μM, 4 h) and stained with HXT (1 μM, 30 min). Immediately after FLIM cells were fixed with 4% paraformaldehyde and stained with anti-BrdU antibody. Scale bar is 50 μm. (b) Average (n = 5) distributions of τm. Black arrow indicates threshold τm, which differentiates between S phase and non S-phase cells. (c) Cell proliferation rates calculated by the different methods. Bar chart shows fractions of total cell numbers and standard deviation for +BrdU cells (S-phase). The mean values were calculated from five different images of the asynchronous and synchronized cell cultures.

