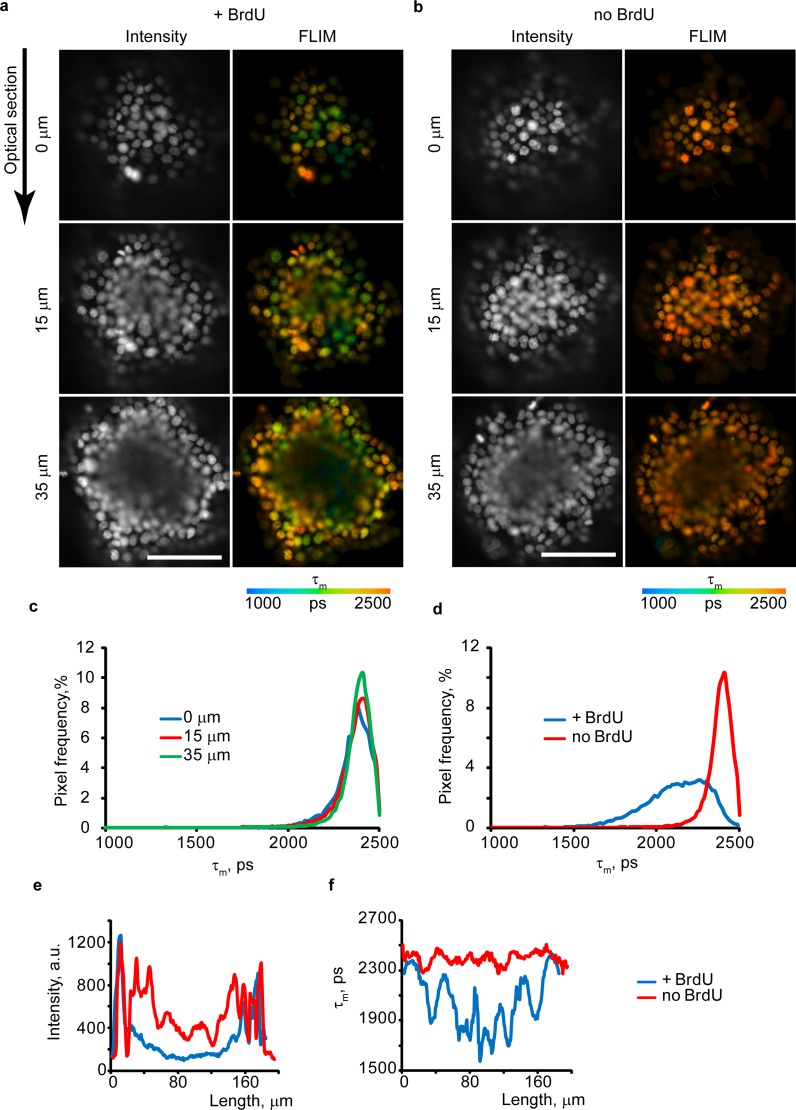
Fig 4. FLIM imaging of live tumor spheroids from HCT116 cells.
(a,b) Confocal optical sections for spheroids loaded or unloaded with BrdU (100 μM, 4 h), collected at different depths. Fluorescence intensity is shown in grayscale. Scale bar is 100 μm. (c, d) τm histograms for different optical sections (depths 0–35 μm) for no BrdU (c) and +BrdU (35 μm depth, d) spheroids. (e,f) Comparison of the Intensity (e) and τm (f) profiles across the spheroid (35 μm depth). Representative images are shown. N = 3.

