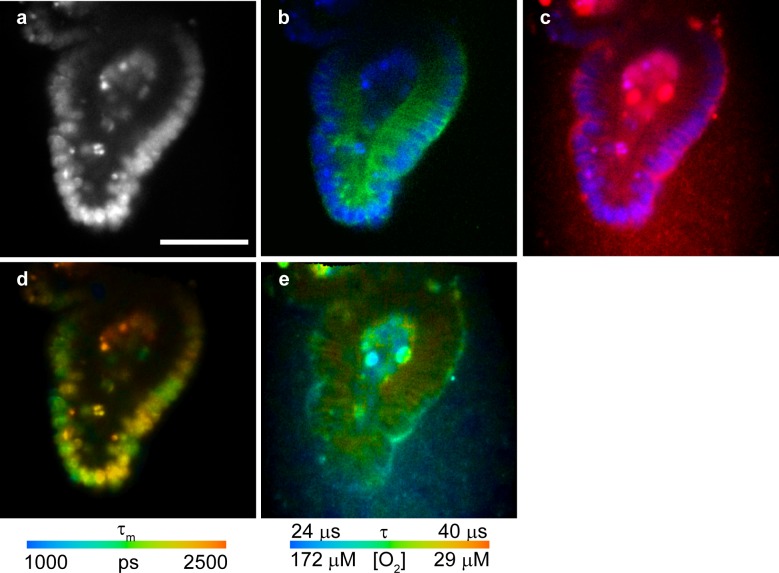
Fig 6. Multi-parametric FLIM imaging of mouse intestinal organoids.
(a,b,c) Intensity images of HXT (a), HXT (blue) merged with lipid raft stain (green) (b), and HXT (blue) merged with cell-penetrating O2-sensitive probe Pt-Glc (red) (c). (d) HXT τm image informing on cell proliferation (405 nm exc., 438–458 nm em.). (e) τm of Pt-Glc (405 nm exc., 635–675 nm em.) informing on cell/tissue oxygenation. Scale bar is 50 μm.

