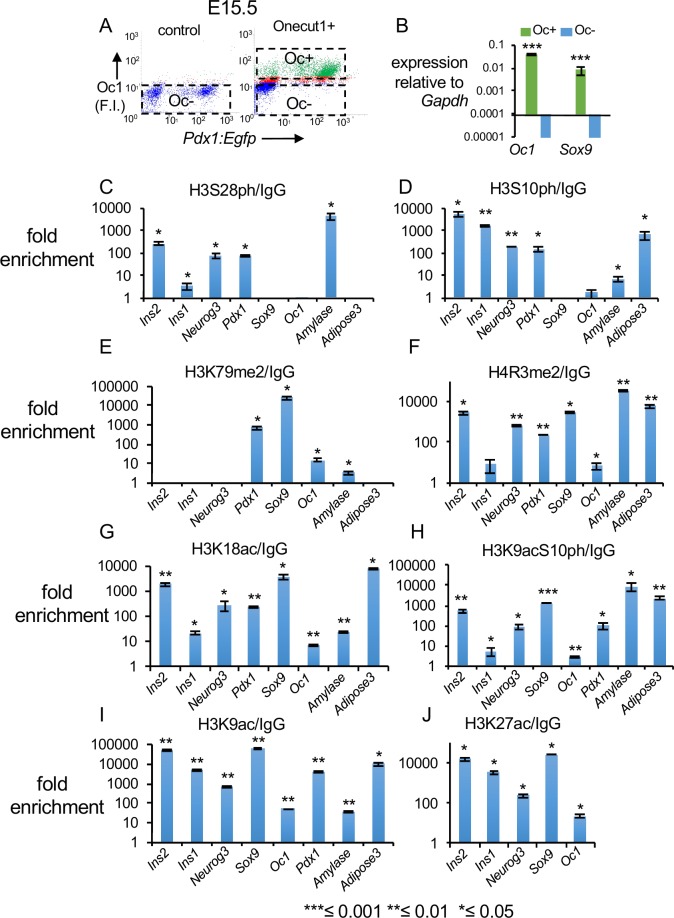
Fig 1. A screen for histone modifications down stream of signaling pathways in E15.5 pancreatic epithelial cells.
(A) FACS scatter plots of cells treated with either IgG (control) or Onecut1 (Oc1+) antibody from Pdx1:Egfp E15.5 pancreata. The FACS purified Oc1+ cells, both Pdx1-GFP+ (Oc1+P+) and Pdx1-GFP- (Oc1+P-), were used for ChIP and qPCR (box labeled Oc+). The x and y axes indicate fluorescence intensity (F.I.). (B) RT-qPCR for ductal transcripts Oc1 and Sox9 in Oc+ (green) and Oc- (blue) cells. (C-J) Patterns for indicated histone modifications at select pancreatic genes (n = 3 technical replicates). Ins2 (Insulin2), Ins1 (Insulin1), Neurog3 (Neurogenin3) and Amyl (Amylase2a). The y-axis shows enrichment over IgG. All P-values were calculated by Student’s t-test, one tailed.

