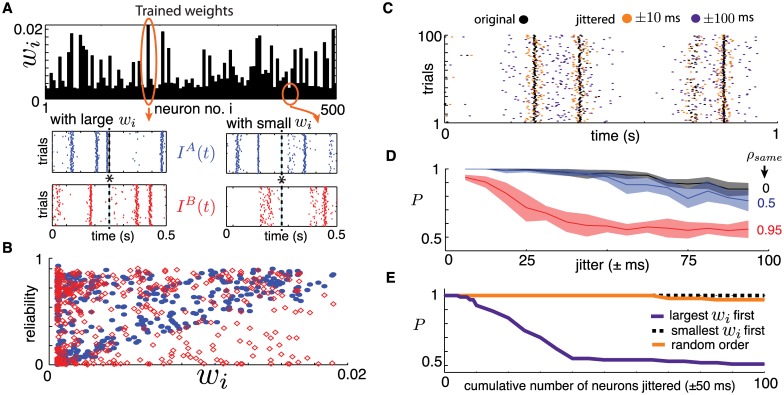
Fig 7.
(A) Top: Trained Tempotron weights wi. Bottom: example cross-trial spiking output for neurons associated with large and small weights wi. Asterisk shows the time at which the maximal value of the Tempotron variable V(t) is obtained (see also Fig 3 (B)). (B) Spike-time reliability for the closest spike to the maximum (asterisk), plotted for each cell against the readout weight wi. Solid blue markers indicate responses to IA(t) and hollow red markers to IB(t). (C) Example raster plot for a single neuron across 100 trials, with and without spike-time jittering. Two jitter strengths shown: ±25 and ±100 ms. (D) The Tempotron’s performance P when all neurons are jittered, plotted against jitter strength, for three values of ρsame. The classifier was trained and tested on jittered spike time data. (E) Tempotron’s performance P against the cumulative inclusion of neurons where the spike times were strongly jittered (±50 milliseconds). Different lines indicate three orderings of neurons the neurons that were jittered, based on their trained readout weight wi: (i) decreasing, (ii) increasing and (iii) random. The classifier was trained on original data and tested on jittered data from a network with N = 500, K = 20. For all panels except (D), ρcorr = ρsame = 0.

