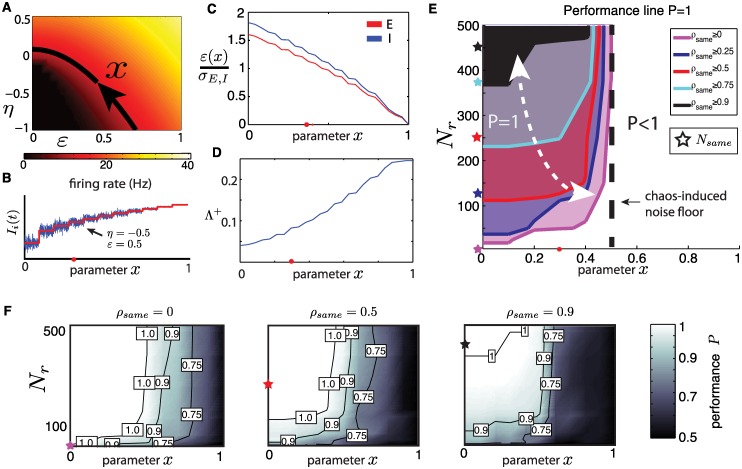
Fig 9.
(A) Mean E firing rate of the network as a function of mean input η and signal amplitude ε. Black curve shows level set at 13 Hz, and is parametrized by the normalized arclength x in direction of arrow. Parameter set used throughout the rest of paper (ε = 0.5, η = −0.5) corresponds to x ≃ 0.3. (B) Illustration of input Ii(t) presented to a neuron as a function of the parameter x. The red line shows the mean η(x) while the blue line shows fluctuations of amplitude ε(x). For all parameters, the mean excitatory firing rate is constant. Red dot shows the benchmark regime (η = −0.5, ε = 0.5). (C) Ratio of stimulus amplitude ε to that of network interaction amplitude σE,I as derived from the mean field equations (see Eq (6)). Red dot shows the benchmark regime (η = −0.5, ε = 0.5). (D) The fraction of positive Lyapunov exponents #{λi > 0}/N as a function of the parameter x. Red dot shows the benchmark regime (η = −0.5, ε = 0.5). (E) Level curves of classification performance P = 1 in the (x, Nr) parameter space for several values of ρsame. For parameter pairs to the left of these curves, the network achieves perfect classification on average. Stars indicate the corresponding Nsame = ρsame N. Red dot shows the benchmark regime (η = −0.5, ε = 0.5). (F) Classification performance P as a function of x and readout dimension Nr for three input similarity fractions ρsame = 0, 0.5, 0.9. Stars indicate the corresponding Nsame = ρsame N. For all P values shown, quantities were sampled over 20 repeated simulations where networks, inputs and Tempotron training were re-processed. Ordered readouts, ρcorr = 0, N = 500, K = 20.

